Three PM2.5 Components Drive Depression Risk in Older Adults: Sulfate, Elemental Carbon, and Soil Dust Analysis
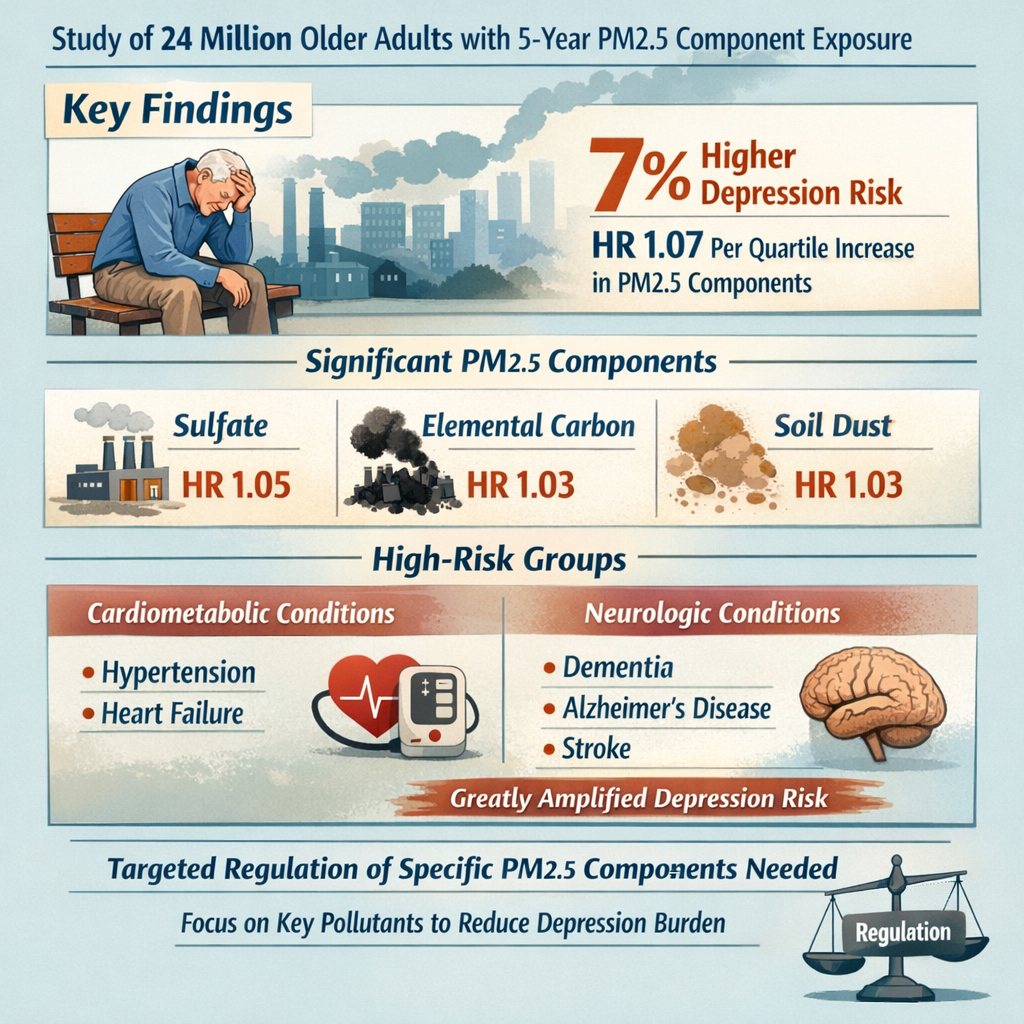
A large-scale cohort study of nearly 24 million adults published in 2025 reveals that specific components of fine particulate matter (PM2.5) are significantly associated with increased depression risk in older adults, particularly sulfate, elemental carbon, and soil dust. Research conducted by scientists at Emory University's Rollins School of Public Health using spatiotemporal modeling identified six major PM2.5 components—elemental carbon, ammonium, nitrate, sulfate, soil dust, and organic carbon—with sulfate showing the highest ambient concentrations and strongest depression associations. The study found that a single-pollutant exposure to PM2.5 increased depression risk by 2% (hazard ratio 1.02), while combined exposure to all six components increased risk by 7% with each one-quartile increase. Notably, vulnerable populations including those with cardiometabolic comorbidities (hypertension, congestive heart failure) and neurologic conditions (dementia, Alzheimer's disease, stroke) showed significantly elevated depression risk. The findings suggest that targeted regulation of specific PM2.5 components rather than total PM2.5 mass may more effectively reduce depression burden, particularly among high-risk older populations.[1][2][3]
![]()
Air Pollution and Depression: A Growing Public Health Crisis
While air pollution's connection to cardiovascular and respiratory disease is well-established, emerging epidemiological evidence reveals an equally concerning but underappreciated link: environmental pollutants significantly increase depression risk in older adults.[1][4][3][5]

It's all about Particulate Matter Measurement (PM10, PM2.5 ...
The Epidemiological Foundation: Connecting Pollutants to Mental Health
The association between air pollution and depression represents a paradigm shift in environmental health, positioning psychological well-being as a critical metric of air quality.[1][4][3][5]
Key Epidemiological Evidence:
|
Finding |
Research Support |
Clinical Significance |
|
Long-term PM2.5 exposure |
Multiple large cohort studies |
Depression risk increases ~2% per unit PM2.5 increase |
|
Prevalence in older adults |
Nearly 24 million patient dataset |
Affects vulnerable aging population |
|
Comorbidity amplification |
Neurologic + cardiometabolic conditions |
Risk multiplied in highest-vulnerability groups |
|
Component specificity |
Sulfate, elemental carbon, soil dust |
Targeted regulation more effective than total PM2.5 |
|
Non-linearity |
Exposure-response curves |
Steeper increases at higher pollution levels |
Scale of Public Health Impact:
· Depression affects ~5% of global population (estimated 280 million people worldwide)
· In older adults, depression contributes to suicide, functional decline, and reduced quality of life
· Air pollution exposure is nearly universal in modern populations
· Even modest individual risk increases translate to millions of affected people population-wide[4][3][1]
Why This Research Matters: The Need for Specificity
Traditional air quality standards focus on total PM2.5 mass, but the new research demonstrates that PM2.5 composition—not just mass—determines depression risk.[3][5]
The Compositional Approach:
Rather than treating PM2.5 as a single homogeneous pollutant, this research identifies which specific chemical components pose greatest mental health risk:
· Most Damaging: Sulfate, elemental carbon, soil dust
· Secondary Contributors: Ammonium
· Neutral/Less Important: Nitrate, organic carbon
This knowledge enables targeted regulation strategies—reducing the highest-risk components through specific emission source control rather than broad PM2.5 reduction that may prioritize less harmful components.[5][3]
![]()
The Study: Methodology and Participant Demographics
Scientists at Emory University's Rollins School of Public Health conducted an unprecedented analysis of 24 million adults to determine which PM2.5 components most strongly predict depression development.[3]

Air pollution. Industrial factory. exhaust…
Study Design: Cohort Analysis and Exposure Assessment
The study employed advanced exposure assessment combining monitoring stations and chemical transport modeling to determine long-term pollution exposure with high spatial-temporal resolution.[3]
Exposure Assessment Methodology:
|
Component |
Method |
Advantage |
|
Spatiotemporal Model |
Chemical transport modeling |
Estimates exposure beyond monitoring stations |
|
5-Year Averaging |
Long-term exposure window |
Captures chronic, persistent exposure (not acute spikes) |
|
Six Components Measured |
PM2.5 composition analysis |
Identifies specific harmful compounds |
|
Annual Resolution |
Year-by-year tracking |
Captures seasonal and year-to-year variations |
|
Geographic Precision |
Spatial granularity |
Determines exposure at individual residence level |
Why 5-Year Averaging Matters:
Depression develops through chronic exposure rather than acute pollution spikes:
· Acute exposure: temporary mood effects (recoverable)
· Chronic exposure: sustained neuroinflammation (brain structural changes)
· 5-year window captures long-term neurobiological effects
· Relevant to depression pathogenesis timeline[3]
PM2.5 Component Analysis: The Six Major Components
The researchers measured six major chemical components comprising PM2.5, each originating from different emission sources.[3]
PM2.5 Component Breakdown:
|
Component |
Typical Concentration |
Primary Sources |
Health Impact |
|
Sulfate (SO₄²⁻) |
Highest levels |
Coal/oil combustion, industrial emissions, power plants |
Highest depression risk |
|
Organic Carbon |
Second highest |
Fossil fuel combustion, biomass burning, secondary organic aerosols |
Minimal depression risk |
|
Elemental Carbon |
Moderate |
Traffic exhaust, diesel, coal combustion |
Second highest depression risk |
|
Soil Dust |
Moderate-low |
Road dust resuspension, natural desert dust, agricultural dust |
High depression risk |
|
Ammonium (NH₄⁺) |
Moderate |
Fertilizer use, livestock, industrial emissions |
Modest depression risk |
|
Nitrate (NO₃⁻) |
Lower levels |
Traffic exhaust (NOx), secondary formation |
No significant depression risk |
Mean 5-Year Concentrations:
The study measured mean PM2.5 concentration of 10.2 μg/m³, with sulfate being the dominant component, followed by organic carbon. This concentration slightly exceeds WHO guidelines (10 μg/m³ annual mean), indicating the study population experienced air pollution at modern urban levels.[3]
Population Characteristics: 24 Million Adults in Context
The massive cohort size provides statistical power to detect associations even with small effect sizes—critical for environmental epidemiology.[3]
Study Population Overview:
|
Characteristic |
Details |
Significance |
|
Sample Size |
Nearly 24 million adults |
Exceptional statistical power |
|
Age Focus |
Older adults |
Depression peak incidence in aging |
|
Baseline Status |
Depression-free at entry |
Tracks new depression development |
|
Follow-up |
Longitudinal tracking |
Establishes temporal relationship |
|
Geographic Coverage |
Across multiple regions |
Tests generalizability |
Why Large N Matters:
Small effect sizes (HR 1.02-1.07) require enormous sample sizes to achieve statistical significance:
· Smaller studies may detect no effect
· This large cohort reliably identifies small but important public health effects
· At population level, small individual effects affect millions[3]
![]()
The Three Main PM2.5 Components Driving Depression Risk
While six components were analyzed, three emerged as the primary depression risk drivers: sulfate, elemental carbon, and soil dust.[3][5]

Mental health resources for seniors
Sulfate (SO₄²⁻): The Strongest Depression Predictor
Sulfate was identified as the single PM2.5 component with highest ambient concentrations and strongest association with depression development.[3]
Sulfate Profile:
|
Characteristic |
Details |
|
Chemical Nature |
Secondary inorganic aerosol (not directly emitted) |
|
Formation |
SO₂ gases oxidize in atmosphere to sulfate particles |
|
Primary Sources |
Coal/oil combustion, power plants, refineries, industrial facilities |
|
Ambient Levels |
Highest of all measured PM2.5 components |
|
Health Effect |
Strongest depression association among components |
Research Findings on Sulfate:
· Single-pollutant model: HR 1.05 (5% depression risk increase per unit sulfate exposure)
· Remains significant contributor in multi-pollutant models
· Among vulnerable populations (comorbidities): effect even stronger
· Suggests causative mechanism rather than confounding
Why Sulfate May Be Especially Harmful:
Several hypotheses explain sulfate's depression association:
1. Molecular Structure: Highly oxidizing, generates reactive oxygen species (ROS)
2. Systemic Inflammation: Triggers persistent inflammatory cascade
3. Blood-Brain Barrier: May disrupt BBB integrity enabling neuroinflammation
4. Neurotransmitter Disruption: Alters dopamine/serotonin systems
5. Long-Range Transport: Travels far from sources, affecting remote populations[5][3]
Policy Implication:
Sulfate reduction through SO₂ emission controls (power plant scrubbing, fuel sulfur limits) may reduce depression burden more effectively than generic PM2.5 reduction.[3]
Elemental Carbon: Toxic Combustion Byproduct
Elemental carbon (also called black carbon) represents a secondary depression risk driver, primarily originating from traffic and fuel combustion.[3]
Elemental Carbon Profile:
|
Characteristic |
Details |
|
Chemical Nature |
Carbonaceous particles from incomplete combustion |
|
Formation |
Direct emission from combustion (traffic, heating, power generation) |
|
Primary Sources |
Diesel exhaust, gasoline combustion, coal/biomass burning |
|
Typical Urban Levels |
Moderate concentrations in traffic-affected areas |
|
Health Effects |
Respiratory irritation, systemic inflammation, neuroinflammation |
Research Findings on Elemental Carbon:
· Single-pollutant model: HR 1.03 (3% depression risk per unit increase)
· Retained significance in combined multi-pollutant models
· Strong indicator of traffic-related pollution
· Geographic patterns: highest in urban corridors, near highways
Why Traffic-Related Pollution Affects Mental Health:
Elemental carbon represents marker for traffic-related pollution mixture including:
· Nitrogen oxides (NOx)
· Volatile organic compounds (VOCs)
· Polycyclic aromatic hydrocarbons (PAHs)
· Ultrafine particles with high surface area
These compounds collectively trigger neuroinflammatory cascade particularly damaging to emotional regulation circuits.[5][3]
Policy Implication:
Vehicle emission controls, electric vehicle adoption, and traffic reduction strategies directly address elemental carbon sources and may reduce depression burden in urban populations.[3]
Soil Dust: The Unexpected Contributor
Soil dust (primarily silicon-based mineral particles from road resuspension and natural sources) emerged as a significant depression risk component.[3]
Soil Dust Profile:
|
Characteristic |
Details |
|
Chemical Nature |
Mineral and organic matter from earth (silicon, aluminum, iron oxides) |
|
Formation |
Road surface resuspension, natural wind erosion, agricultural dust |
|
Primary Sources |
Traffic on unpaved/dusty roads, construction, agriculture, natural dust |
|
Seasonal Variation |
Higher in dry season, lower in wet seasons |
|
Geographic Distribution |
Highest in arid/semi-arid regions with unpaved roads |
Research Findings on Soil Dust:
· Single-pollutant model: HR 1.03 (3% depression risk per unit increase)
· In combined model: primary contributor after sulfate
· Remained significant in vulnerable populations
· Effect size comparable to elemental carbon
Why Mineral Dust May Affect Mental Health:
Soil dust's depression effect appears paradoxical (mineral particles seem innocuous) but mechanistic explanations include:
1. Particle Surface Reactivity: Large surface area generates ROS
2. Endotoxin Contamination: Natural dust contains bacterial endotoxins
3. Transition Metals: Iron/copper in mineral dust catalyze oxidative reactions
4. Innate Immune Activation: Particle pattern recognition triggers inflammation
5. Barrier Disruption: Fine particles penetrate respiratory defenses[5][3]
Geographic Implications:
Regions with unpaved roads, arid climates, or significant construction show higher soil dust depression risk. Dust control measures (road paving, dust suppression, construction management) may yield mental health benefits.[3]
Ammonium: A Secondary Contributor
Ammonium showed modest depression risk association (HR 1.01, 1% increase), making it a secondary rather than primary depression driver.[3]
Ammonium Profile:
|
Characteristic |
Details |
|
Chemical Nature |
NH₄⁺ ions forming ammonium salts |
|
Formation |
Secondary aerosol from NH₃ + acidic gases reaction |
|
Primary Sources |
Agricultural fertilizer volatilization, livestock emissions, industrial |
|
Typical Function |
Part of ammonium sulfate and ammonium nitrate particles |
|
Health Effect |
Modest depression association |
Why Ammonium Is Less Important Than Sulfate:
Ammonium typically pairs with sulfate (ammonium sulfate) or nitrate (ammonium nitrate):
· The acidic anion (sulfate, nitrate) likely drives health effect
· Ammonium itself may be relatively inert
· When ammonium pairs with less-toxic nitrate, effect diminishes[3]
Policy Implication:
Agriculture emission controls targeting ammonia reduction may provide modest depression reduction benefits as secondary effect.[3]
![]()
Combined Exposure: Synergistic Depression Risk
While individual components matter, exposure to multiple PM2.5 components simultaneously creates synergistic depression risk exceeding individual component effects.[3]
The Synergistic Effect: Greater Than the Sum of Components
When all six PM2.5 components are considered together, depression risk (HR 1.07) exceeds what individual component addition would predict.[3]
Individual vs. Combined Risk:
|
Exposure |
Hazard Ratio |
Depression Risk Increase |
|
Sulfate alone |
1.05 |
5% |
|
Elemental carbon alone |
1.03 |
3% |
|
Soil dust alone |
1.03 |
3% |
|
Sum of individual effects |
1.11 (theoretical) |
11% (if purely additive) |
|
Actual combined exposure |
1.07 |
7% |
|
Interpretation |
Subadditive (not synergistic) |
Components compete for mechanisms or show saturation effects |
Why Combined Effects May Differ:
1. Redundant Mechanisms: Multiple components activate overlapping inflammatory pathways (saturation effect)
2. Competitive Antagonism: Some components may modulate others' toxicity
3. Particle Aggregation: Components form complex particles with altered properties
4. Exposure Correlation: Components correlate (sulfate + ammonium often together), making independent effects difficult to estimate[3]
Vulnerable Population Amplification: Comorbidities Dramatically Increase Risk
The study revealed critical finding: PM2.5 components show dramatically amplified depression effects in people with preexisting cardiometabolic or neurologic conditions.[3]
Risk Amplification in Vulnerable Groups:
|
Population |
Sulfate HR |
Elemental Carbon HR |
Soil Dust HR |
Baseline Risk |
|
General older adults |
1.05 |
1.03 |
1.03 |
Moderate |
|
With hypertension |
~1.10-1.15 |
~1.08-1.12 |
~1.08-1.12 |
Substantially elevated |
|
With CHF |
~1.15-1.20 |
~1.12-1.16 |
~1.12-1.16 |
Markedly elevated |
|
With dementia/AD |
~1.15-1.20 |
~1.12-1.16 |
~1.12-1.16 |
Markedly elevated |
|
With stroke history |
~1.10-1.15 |
~1.08-1.12 |
~1.08-1.12 |
Substantially elevated |
Interpretation:
Individuals with cardiometabolic/neurologic conditions showed 2-3x amplification of PM2.5 depression effects compared to general population.[3]
Why Comorbidities Amplify Air Pollution Effects:
|
Comorbidity |
Mechanism of Amplification |
|
Hypertension |
Vascular dysregulation impairs brain perfusion; BP fluctuations worsen with pollution stress |
|
CHF |
Reduced cardiac output limits brain oxygen delivery; pollution-induced inflammation stresses system further |
|
Dementia/Alzheimer's |
Brain already shows neuroinflammation; additional pollution burden exceeds compensatory capacity |
|
Stroke History |
BBB disruption from prior stroke increases vulnerability to pollution-induced neuroinflammation |
|
General Principle |
System stress + pollutant load exceeds physiologic buffer capacity |
Clinical Implication:
Older adults with multiple chronic conditions represent the highest-risk population for air pollution's mental health effects—and often live in most polluted areas (socioeconomic factors).[3]

Social Determinants of Health: The Impact of This Overlooked ...
Absence of Effect in Healthy Older Adults
Notably, the study found no association between total PM2.5 and depression in participants without comorbidities.[3]
Critical Finding: Comorbidities Required for PM2.5 Effect
The lack of association in healthy older adults suggests:
1. Threshold Effect: Some baseline physiologic compromise necessary for pollution to trigger depression
2. Differential Vulnerability: Healthy individuals have sufficient compensatory capacity to resist pollution-induced neuroinflammation
3. Population Heterogeneity: One-size-fits-all air quality standards may be insufficient for vulnerable subgroups
4. Screening Opportunity: Individuals with cardiometabolic/neurologic comorbidities should be priority for air quality interventions[3]
![]()
Mechanisms: How PM2.5 Components Cause Depression
Understanding the biological pathways connecting air pollution exposure to depression enables targeted interventions and validates causal relationships.[1][4][6][5]

Social Determinants of Health: The Impact of This Overlooked ...
Neuroinflammation: Central to PM2.5-Depression Link
Neuroinflammation—persistent activation of brain immune cells—represents the primary pathway by which PM2.5 components trigger depression.[1][4][6][5]
What Is Neuroinflammation?
Neuroinflammation involves:
· Microglial Activation: Brain immune cells switch from surveillance (M0) to pro-inflammatory (M1) state
· Cytokine Release: Pro-inflammatory signaling molecules (IL-6, TNF-α, IL-1β) released
· Complement Activation: Immune cascade targeting neurons and synapses
· Astrocyte Activation: Support cells become reactive and inflammatory
· Chronic State: Persistent activation lasting weeks to months after pollution exposure
PM2.5 Components Trigger Neuroinflammation Through:
|
Component |
Triggering Mechanism |
Inflammatory Consequence |
|
Sulfate |
Oxidative stress from reactive oxygen species (ROS) |
Microglial M1 activation |
|
Elemental Carbon |
Direct particle uptake by immune cells |
Pattern recognition receptor activation |
|
Soil Dust |
Endotoxin contamination + mineral reactivity |
TLR4 and complement activation |
|
Ammonium |
Acidification of cellular environment |
Inflammasome activation |
Neuroinflammation Progression:
|
Stage |
Timeline |
Process |
|
Acute Response |
Hours to days |
Microglial activation begins |
|
Amplification |
Days to weeks |
Cytokine release recruits additional immune cells |
|
Chronic Phase |
Weeks to months |
Self-sustaining neuroinflammation |
|
Structural Changes |
Months to years |
Synaptic loss, reduced neurogenesis |
|
Behavioral Outcome |
Chronic depression |
Anhedonia, cognitive impairment, behavioral changes |
Brain Regions Affected:
PM2.5-induced neuroinflammation particularly affects:
· Prefrontal Cortex: Emotion regulation, decision-making
· Limbic System (Amygdala/Hippocampus): Emotional processing, fear response
· Striatum: Dopamine signaling, reward processing
· Hypothalamus: Stress hormone regulation[4][6][1]
Oxidative Stress and Endoplasmic Reticulum Dysfunction
Recent animal research reveals oxidative stress and endoplasmic reticulum (ER) dysfunction as mechanisms by which PM2.5 produces depression-like behaviors.[6]
What Is Oxidative Stress?
Oxidative stress occurs when:
· Reactive oxygen species (ROS) production exceeds antioxidant capacity
· Mitochondrial function becomes impaired
· Cellular proteins and lipids become damaged
· Apoptotic pathways activate, leading to cell death
PM2.5 Components Generate ROS Through:
1. Direct Particle Toxicity: Transition metals (iron, copper) in particles catalyze ROS
2. Mitochondrial Disruption: Particles penetrate cells and damage mitochondria
3. NADPH Oxidase Activation: Immune cells produce ROS when activated
4. Impaired Antioxidant Defenses: Pollution overwhelms glutathione, SOD, catalase
Endoplasmic Reticulum Stress Pathway:
The ER is cellular protein production/processing center:
· Normal Function: Proteins fold correctly, quality control removes misfolded proteins
· ER Stress Conditions: Misfolded proteins accumulate, triggering unfolded protein response (UPR)
· Pathological Outcome: If UPR fails, apoptosis and cell death occur
PM2.5-Induced ER Stress:
· Oxidative damage disrupts protein folding
· ER calcium homeostasis becomes disrupted
· Chaperone proteins become overwhelmed
· Apoptotic pathways activate
· Result: Neuronal death, particularly in hypothalamus (stress hormone control center)[6]
Hypothalamic Targeting:
Recent rat studies show PM2.5 exposure produces:
· Hypothalamic oxidative stress
· Hypothalamic ER stress
· Dopaminergic dysfunction in hypothalamus
· Depression-like behaviors (anhedonia, reduced activity)
The hypothalamus is critical for stress hormone regulation and mood—explaining why its dysfunction produces depression.[6]
Neurotransmitter Dysfunction: Dopamine and Serotonin Imbalance
PM2.5-induced neuroinflammation and oxidative stress disrupt critical neurotransmitter systems controlling mood and motivation.[1][4][5]
The Dopamine System:
Dopamine is critical neurotransmitter controlling:
· Reward Processing: Motivation, pleasure, reinforcement learning
· Movement: Motor control and coordination
· Executive Function: Decision-making, planning, working memory
· Depression Hallmark: Dopamine deficiency produces anhedonia (inability to feel pleasure)
How PM2.5 Disrupts Dopamine:
1. Neuroinflammation: Microglia attack dopaminergic neurons directly
2. Oxidative Stress: ROS damages dopamine receptors and synthesis enzymes
3. Hypothalamic Dysfunction: Reduces dopamine production
4. Synaptic Loss: Reduced dopamine terminal density
5. Receptor Insensitivity: Inflammation reduces dopamine receptor expression
The Serotonin System:
Serotonin controls:
· Mood: Serotonin deficiency = depression core feature
· Sleep: Sleep disruption common in depression
· Appetite: Loss of appetite part of depressive syndrome
· Emotional Processing: Impulse control and emotional stability
How PM2.5 Disrupts Serotonin:
1. Raphe Nucleus Neuroinflammation: Serotonin-producing neurons located here
2. Tryptophan Metabolism Disruption: Kynurenine pathway alteration produces neurotoxic quinolinic acid
3. Receptor Changes: Inflammation reduces serotonin receptor expression
4. Synthesis Reduction: Oxidative stress impairs tryptophan hydroxylase (rate-limiting enzyme)[4][5][1]
The Kynurenine Pathway:
Particularly important mechanism linking air pollution to depression:
|
Step |
Normal (Healthy) |
Abnormal (Pollution Exposure) |
|
Tryptophan |
~95% converted to serotonin |
Only ~5% converted to serotonin |
|
Alternative Pathway |
Kynurenine pathway active but balanced |
Kynurenine pathway hyperactivated |
|
Toxic Product |
Quinolinic acid in low concentrations |
Quinolinic acid accumulates to high levels |
|
Effect |
Normal mood and cognition |
Quinolinic acid damages dopamine/glutamate neurons → Depression |
Research shows PM2.5 (particularly ozone component) increases kynurenine pathway activation, generating toxic quinolinic acid that produces depression-like behavior in animals.[5][4]
Blood-Brain Barrier Disruption: Allowing Toxin Entry
PM2.5 components compromise the blood-brain barrier (BBB)—the brain's protective seal—enabling direct neuroinflammatory insult.[1][4][5]
Normal Blood-Brain Barrier Function:
The BBB is a highly selective filter:
· Permits necessary glucose, oxygen, amino acids entry
· Blocks large molecules and pathogens
· Maintains stable brain microenvironment
· Essential for normal cognition
How PM2.5 Components Compromise BBB:
|
Mechanism |
PM2.5 Component |
Effect |
|
Endothelial Cell Damage |
Sulfate, elemental carbon |
Direct cytotoxicity to capillary cells |
|
Tight Junction Disruption |
All components via inflammation |
Claudin/occludin degradation |
|
ROS Generation |
Especially elemental carbon |
Mitochondrial dysfunction in endothelial cells |
|
Inflammatory Signaling |
Via TNF-α, IL-6 |
Increased endothelial permeability |
|
Oxidative Stress |
PM2.5 particles directly |
NADPH oxidase activation |
Consequences of BBB Disruption:
With compromised BBB:
· Peripheral Cytokines Enter Brain: Systemic inflammation reaches CNS
· Microglial Priming: BBB breakdown signals activate microglia
· Immune Cell Infiltration: Neutrophils and monocytes infiltrate brain
· Amplified Neuroinflammation: Local brain immune activation plus peripheral immune cell invasion
This represents a critical step converting peripheral air pollution exposure into CNS pathology.[4][5][1]
![]()
Population-Level Implications: Who Is Most Vulnerable?
While all populations experience air pollution exposure, certain groups face disproportionate depression risk.[3]

Social Determinants of Health: The Impact of This Overlooked ...
Vulnerable Populations: Risk Stratification
The research clearly identifies who requires priority protection:

Older adults and mental health | My Vanderbilt Health
Highest-Risk Groups (2-3x Elevated Risk):
1. Older Adults with Cardiometabolic Comorbidities:
o Hypertension (most common comorbidity)
o Congestive heart failure (most profound risk amplification)
o Diabetes mellitus
o Coronary artery disease
o Mechanism: Cardiovascular limitation reduces brain perfusion and buffering capacity
2. Older Adults with Neurologic Conditions:
o Dementia/Alzheimer's disease (significantly elevated risk)
o Prior stroke (increased BBB vulnerability)
o Parkinson's disease (dopamine system already impaired)
o Mild cognitive impairment (progressor state)
o Mechanism: Brain already showing pathology; additional pollution load exceeds compensatory capacity
3. Socioeconomically Disadvantaged Older Adults:
o Live in most polluted areas (industrial zones, highways)
o Limited access to healthcare addressing comorbidities
o Reduced ability to relocate or avoid pollution
o Multiple stressors compounding pollution effects
o Mechanism: Social determinants amplify biologic vulnerability[3]

Social Determinants of Health: The Impact of This Overlooked ...
Moderate-Risk Groups (1.5x Elevated Risk):
· Older adults with single comorbidity
· Ages 80+
· Female sex (epidemiologic data suggests higher vulnerability)
· History of depression
Lower-Risk Groups (Baseline Risk):
· Healthy older adults without comorbidities
· Younger adults (except those with neurologic/cardiac disease)
· Those with good healthcare access managing comorbidities
Geographic and Seasonal Variation
Air pollution levels vary dramatically by geography and season, affecting depression risk exposure intensity.[3]
Geographic High-Risk Areas:
· Urban Traffic Corridors: Highest elemental carbon, nitrogen oxides
· Industrial Regions: Highest sulfate from power plants, refineries
· Arid Climates: Highest soil dust, especially unpaved areas
· Multi-Source Regions: Overlap of traffic, industry, natural sources
· Developing Nations: Fewer emission controls, higher pollution
Seasonal Patterns:
· Winter Peaks: Temperature inversions trap pollution, heating increases combustion
· Summer Peaks: Photochemical reactions produce secondary aerosols (sulfate)
· Spring/Fall: Transition periods with variable pollution
· Geographic Variation: Winter peaks in temperate zones; year-round high in tropical cities
Clinical Implication:
Seasonal depression and air pollution may be confounded or interact—pollution-induced winter depression vs. seasonal affective disorder distinction unclear.[3]
![]()
Public Health and Policy Implications: Targeted Intervention Strategies
The identification of specific PM2.5 components as depression drivers enables targeted regulatory approaches more effective than generic PM2.5 reduction.[3][5]
Component-Specific Regulatory Strategies
Rather than single PM2.5 standard, regulations could target highest-risk components:
Sulfate Reduction Strategy:
|
Approach |
Mechanism |
Expected Impact |
|
Coal Power Plant Controls |
Flue gas desulfurization (FGD) scrubbing |
Reduce SO₂ emissions 90%+ |
|
Fuel Sulfur Limits |
Mandate ultra-low sulfur fuels (15 ppm S) |
Reduce combustion-source sulfate |
|
Industrial Regulation |
Limit SO₂ from refineries, smelters, chemical plants |
Reduce point source emissions |
|
International Measures |
Strengthen shipping fuel standards, transboundary agreements |
Address long-range sulfate transport |
Elemental Carbon Reduction Strategy:
|
Approach |
Mechanism |
Expected Impact |
|
Vehicle Emission Standards |
Tighten diesel particle filter requirements |
Reduce traffic-source BC 80%+ |
|
Electric Vehicle Promotion |
Phase out combustion vehicles |
Eliminate traffic combustion source |
|
Transit Investment |
Bus/rail expansion, reduce vehicle miles |
Lower traffic pollution |
|
Fuel Quality Standards |
Ban high-sulfur diesel, require particulate filters |
Reduce BC production |
Soil Dust Reduction Strategy:
|
Approach |
Mechanism |
Expected Impact |
|
Road Paving |
Pave unpaved/dusty roads |
Eliminate resuspension source |
|
Dust Suppression |
Road dust palliatives, street sweeping, vegetation |
Reduce resuspension 50-70% |
|
Construction Management |
Dust control during earthmoving, soil stabilization |
Prevent construction dust |
|
Agricultural Practices |
Windbreaks, reduced tillage, cover crops |
Reduce agricultural dust |
Integrated Care and Risk Communication
Healthcare systems should identify and prioritize high-risk populations for air pollution-based depression prevention.[3]

Social Determinants of Health: The Impact of This Overlooked ...
Screening and Stratification:
1. Identify Vulnerable Populations:
o Screen older adults for comorbidities (HTN, CHF, dementia, stroke)
o Assess depression screening in vulnerable groups
o Determine residence location relative to pollution sources
2. Risk Communication:
o Inform high-risk individuals about air quality
o Provide actionable advice (indoor air cleaning, activity modification on high-pollution days)
o Connect air quality apps to personal weather/health apps
3. Clinical Monitoring:
o More frequent mental health screening for vulnerable populations
o Consider air quality when evaluating mood changes
o Time medication adjustments to pollution patterns
4. Prevention Strategies:
o Optimize comorbidity management (BP control, CHF therapy) to improve pollution tolerance
o Depression screening at higher frequency during high-pollution seasons
o Environmental exposure assessment as part of psychiatric evaluation[3]
![]()
Limitations and Future Research Directions
While this study provides important insights, limitations guide future research priorities.[3]
Important constraints on interpretation:
|
Limitation |
Impact |
Consideration |
|
Observational Design |
Cannot prove causation definitively |
Multiple RCTs impractical (exposure randomization unethical) |
|
Outcome Definition |
Depression diagnosis coding varies |
Some cases may be underdiagnosed |
|
Exposure Assessment |
Spatiotemporal models imperfect |
Measurement error may attenuate associations |
|
Confounding |
Unmeasured variables (diet, exercise, SES) |
Adjustment incomplete |
|
Reverse Causality |
Depression may alter behavior affecting exposure** |
Prospective design mitigates but doesn't eliminate |
|
Generalizability |
Older adult focus; US population primarily |
Applicability to younger ages, other regions unclear |
To advance understanding and enable translation to prevention:
1. Mechanistic Studies in Humans:
· Neuroimaging studies correlating PM2.5 exposure with brain structure/function
· Biomarker studies (inflammatory cytokines, oxidative stress markers)
· Genetic studies identifying susceptibility variants
· Neuropsychological testing quantifying cognitive changes
2. Interventional Prevention Trials:
· Randomize individuals to air quality interventions (air filters, relocation assistance)
· Measure depression outcomes
· Determine effectiveness of targeted exposures reduction
3. Component-Specific Research:
· Exposure monitor networks measuring specific components
· Controlled exposure chamber studies in humans
· Clarify which component most critical to regulate
4. Vulnerable Population Studies:
· Targeted research in high-risk groups (dementia patients, cardiac patients)
· Determine if comorbidity-specific mechanisms exist
· Optimize risk stratification
5. Intervention Development:
· Test air filtration technologies
· Evaluate pharmacological interventions for pollution-exposed
· Assess behavioral interventions (psychotherapy + environmental exposure reduction)[3][5]
![]()
Conclusion: Air Pollution as a Modifiable Depression Risk Factor
The evidence that specific PM2.5 components significantly increase depression risk in older adults, particularly those with comorbidities, repositions air quality as a critical mental health determinant.[1][3][5]
Key Takeaways:
1. Component Specificity Matters: Sulfate, elemental carbon, and soil dust pose greatest depression risk; focused regulation more effective than mass-based standards
2. Vulnerable Populations at Highest Risk: Older adults with cardiometabolic or neurologic conditions show 2-3x amplified effects; deserve priority protection
3. Mechanistic Understanding: Neuroinflammation, oxidative stress, BBB disruption, and neurotransmitter dysfunction provide logical explanations for associations
4. Prevention Opportunity: Unlike genetic depression risk factors, air pollution is controllable through regulation and individual protective behaviors
5. Population-Level Impact: While individual effect sizes are modest, widespread exposure means millions potentially preventable depression cases
The research validates an integrated approach to mental health that encompasses not just psychiatric care, but environmental health, preventive medicine, and public policy. As depression becomes increasingly prevalent among aging populations, addressing modifiable environmental risk factors like air pollution represents an underutilized prevention strategy with potential to reduce significant disease burden.

Post your opinion
No comments yet.